BioNTech-Pfizer COVID-19 Vaccine Candidate Efficacy - Part 2
Nov 12, 2020 · 373 words · 2 minutes read
My last post showed the posterior distribution for the BioNTech-Pfizer vaccine candidate efficacy, given some assumptions. Others also inferred 8 out of 94 cases occurred in the treatment group and a 95% credible interval of 81.6% to 95.6%. Yet others have suggested the the candidate’s efficacy could be higher; if the treatment group had only 5 confirmed cases the efficacy would have been 94.4% – just shy of a nice round 95% cutoff.
In this post I look at a two other scenarios: optimistic and pessimistic scenarios.
For the optimistic scenario, the press release statement that the vaccine candidate is “more than 90% effective” is an extremely conservative estimate. In this hypothetical, the vaccine candidate is nearly perfect. The executives and marketing team are cautious that the interim results may not show the complete picture and want to avoid potential blowback in the case that later analysis shows lower efficacy. For this optimistic scenario only 5 out of the 94 confirmed cases occurred in the treatment group.
The pessimistic scenario considers the worst possible case in which the 95% credible interval contains (barely) the stated “more than 90% effective”. In this hypothetical, the executives and marketing team saw the upper 95% credible interval was (barely) above 90% and ran with it. For this pessimistic scenario there were 14 confirmed cases in the treatment group.
As reference, I include the posterior distribution from the previous post. I refer to this as the “probable” scenario. The plot below shows the posterior densities for each scenario.
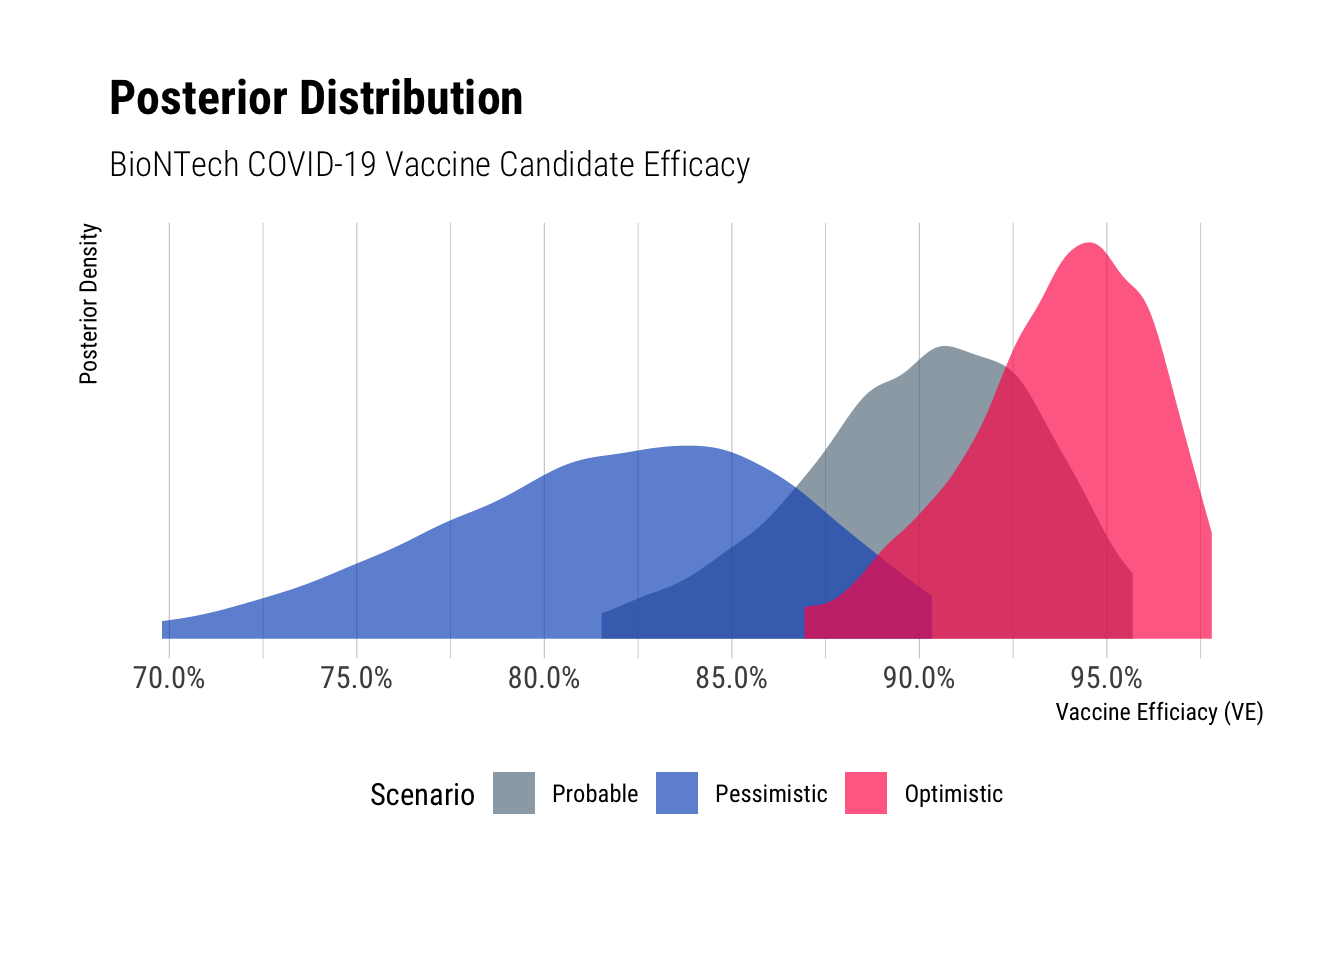
The pessimistic 95% credible interval ranges from 69.9% to 90.2% and optimistic credible interval ranges from 87.0% to 97.7%. Interestingly the optimistic scenario isn’t that much better than the probable scenario as there’s significant overlap (54%!) between the posterior intervals. The pessimistic scenario credible interval only overlaps with the probable scenario by 35%.
I think it’s more likely that the vaccine candidate is closer to the optimistic scenario than the pessimistic scenario but BioNTech and Pfizer haven’t released details from the interim analysis so we don’t know the likelihood they used. The exact number of confirmed cases in the treatment group at the time of their analysis changes the vaccine candidate’s posterior distribution. Thus it’s reasonable to explore different scenarios.