Speed Test Report: February 2018
Mar 17, 2018 · 267 words · 2 minutes read
This is my second post in the speed test report series (read the January 2018 report here). This month I conducted 1,298 speed tests. Of these, 698 tests were against the nearest site in Chicago.
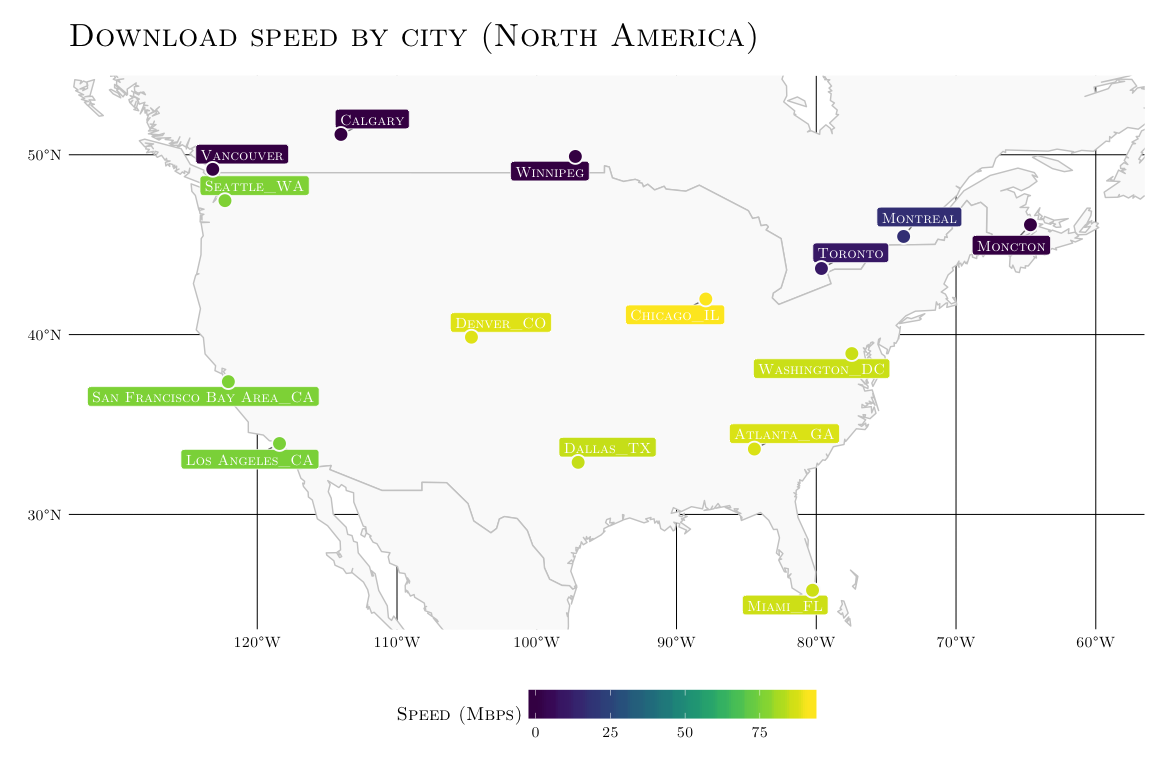
The map below is a close-up of North America. Each labelled city hosts a M-Lab site and is colorized by median download speed. Download speeds are faster from sites in the United States than in Canada, even though some Canadian cities are geographically closer. Because speeds to Canadian servers are much lower than their American counterparts (e.g. Vancouver’s median download speed of 0 Mbps compared to Seattle’s 76.27 Mbps) there appears to be strong penalty for sites outside the United States.
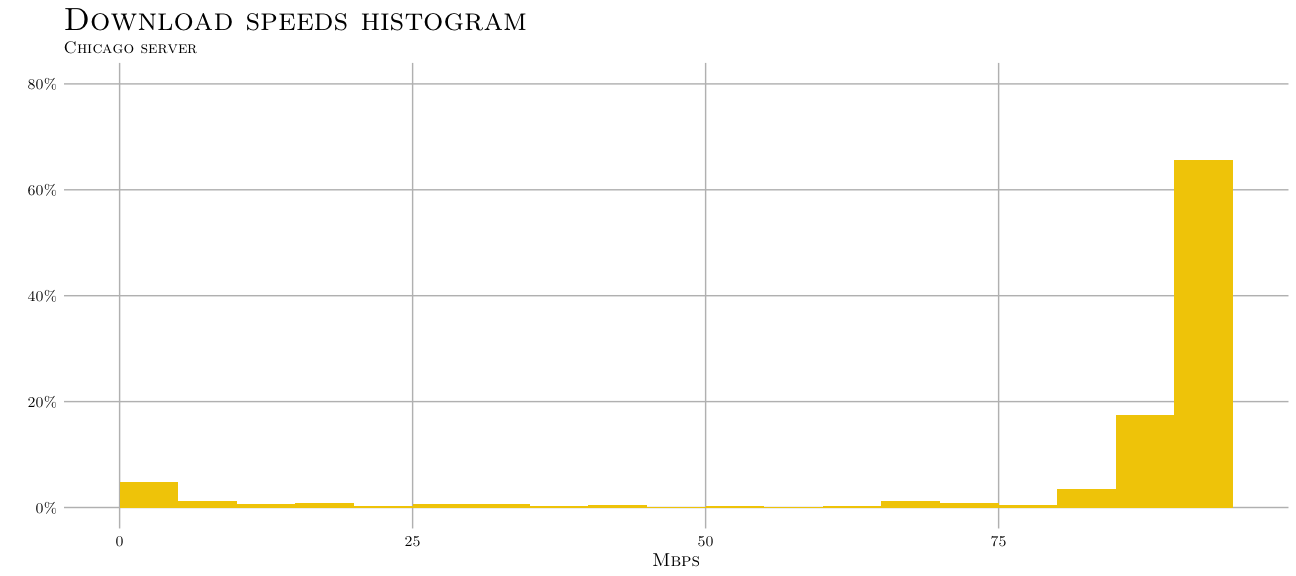
As with January, this month I looked at a histogram of download speeds for the Chicago site. The February histogram shows marked improvement over January with more than 65% of speed tests to Chicago achieving a download speed of at least 90 Mbps and 87% with at least 75 Mbps.
It is worth noting that my script is running on a Raspberry Pi 3 B (not the new 3 B+) which has a max Rx bandwidth of 95.5 Mbps. Therefore it is entirely possible that I’m getting even faster speeds.
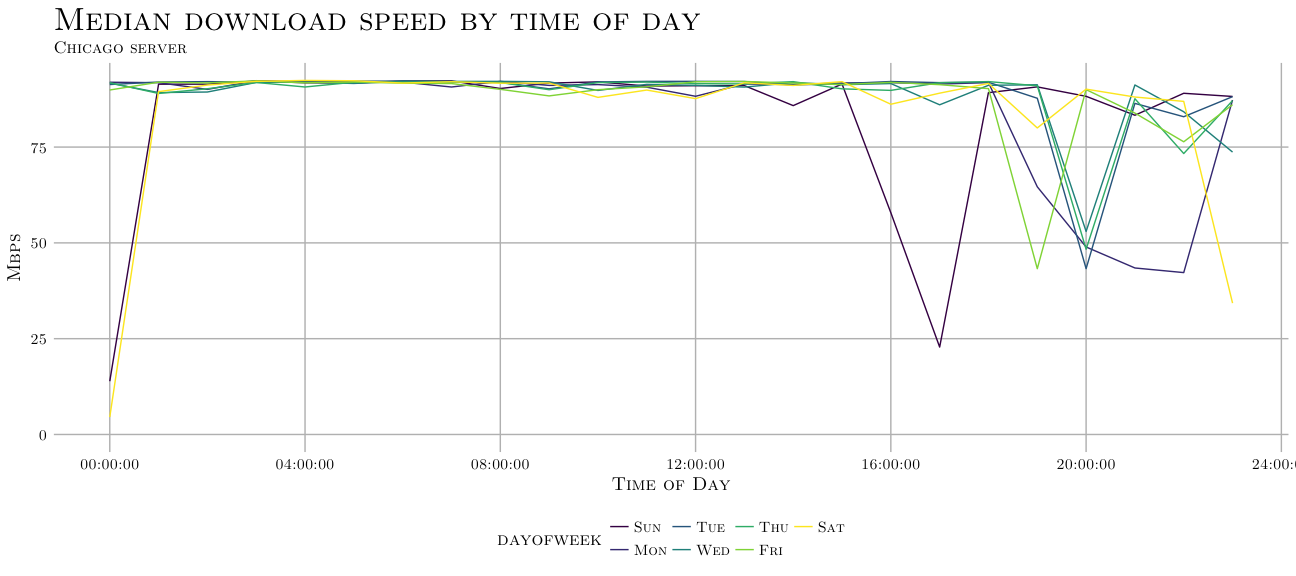
Despite the overall improvement in download speeds, I wanted to see if lower speeds occurred systematically or were random events. To this end I graphed the median download speed by time of day and day of the week. The plot shows lower median download speeds during the evening, which might be explained by congestion on the ISP network during peak use.